Opening Statement
Statement by the Chair of Avon Fire Authority and Chief Fire Officer
Our commitment to fairness, inclusion, and transparency remains central to the way we serve our communities. As a public service, we recognise that the trust placed in us extends beyond emergency response – it includes how we support, value, and represent the people who work within Avon Fire & Rescue Service. This year’s Gender and Ethnicity Pay Gap Report provides an important reflection of where we stand and the progress we continue to make.
The findings confirm that our pay gaps are driven by the composition of our workforce rather than unequal pay for equal work. This is reassuring, but it also highlights the structural patterns we must continue to address, particularly in relation to the representation of women and minority ethnic colleagues in operational and higher-paid roles. These patterns have developed over many years across the fire and rescue sector, and we remain committed to changing them through sustained, meaningful action.
We recognise that improving diversity is not simply a matter of numbers – it is about creating pathways, support systems, and an organisational culture where every individual has the opportunity to succeed. This includes targeted recruitment, strengthened career development and promotion processes, and ongoing investment in our inclusion at Avon Fire and Rescue Service.
While our pay gaps are modest, they remind us that there is more to do. We will continue to take a proactive, evidence-based approach to ensuring equitable opportunities at every level of the Service. Our ambition is a workforce that not only reflects the communities we serve, but one where every colleague feels valued, supported, and empowered to reach their full potential. Together, with continued focus and collective effort, we will build a stronger, more inclusive organisation for the future.

2026

2026
Executive Summary
Our analysis of gender and ethnicity pay gaps highlights that both are primarily influenced by workforce composition rather than unequal pay for equal work. For gender, women make up 22.28% of the workforce, but their representation varies significantly across pay quartiles. Women are most represented in the lowest-paid quartile (37.1%) and least represented in the middle quartiles (9.5% and 13.3%), which are dominated by operational roles. In the highest-paid quartile, women account for 29.3%, which is an improvement compared to the middle quartiles but still reflects that men hold the majority of senior and higher-paid positions. This distribution explains why the gender pay gap persists, as women are more likely to occupy lower-paid non-uniformed roles.
For ethnicity, the workforce is predominantly White British (83.4%), with ethnic minority groups representing only 2.8% and White Minority Ethnic employees 2.1%. A further 11.7% of staff have not declared their ethnicity, which limits the accuracy of the analysis. The median hourly rate is equal across all groups (£17.20), resulting in a 0% median pay gap, indicating parity at the midpoint of pay distribution. However, the mean hourly rate shows a gap: White British employees earn £18.87, compared to £18.42 for minority groups – a difference of -2.4%. The largest gap is for White Minority Ethnic employees (-4.7%), while Ethnic Minority employees are closer to parity (-2.0%). These findings suggest that minority groups are underrepresented in higher-paid roles, which drives the mean gap.
Both gender and ethnicity pay gaps reflect structural patterns in workforce composition rather than direct pay inequality. Addressing these gaps will require improving representation in higher-paid and operational roles, increasing declaration rates for ethnicity data, and supporting career progression for underrepresented groups. While the gaps are modest, they highlight the need for continued focus on diversity, inclusion, and equal opportunities across all levels of the organisation.
Introduction
What?
This report presents Avon Fire and Rescue Service’s (AF&RS) analysis of both the gender pay gap and the ethnicity pay gap for the most recent reporting period. Its purpose is to provide a transparent account of pay differences within our workforce, to explain the underlying factors that contribute to those differences, and to outline the steps we are taking to advance equality, diversity, and inclusion across the organisation.
When?
Under UK legislation, all employers with 250 or more employees are required to publish annual data on their gender pay gap. While ethnicity pay gap reporting is not currently mandatory, it is increasingly recognised as a key tool for understanding and addressing inequalities in the workplace. As a public sector organisation committed to fairness, equity, and our obligations under the Public Sector Equality Duty, we choose to report on ethnicity pay alongside our statutory gender reporting to demonstrate leadership, accountability, and a commitment to continuous improvement.
Our Workforce Profile
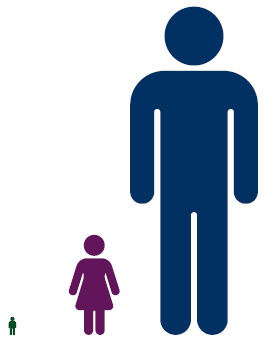
Gender
| Gender | Employees | Percentage Workforce |
|---|---|---|
| Female: | 207 | 22.2% |
| Male: | 722 | 77.4% |
| Identifies as something other than male or female/ Would prefer not to say: | 4 | 0.4% |
| Total | 933 | 100% |
Ethnicity
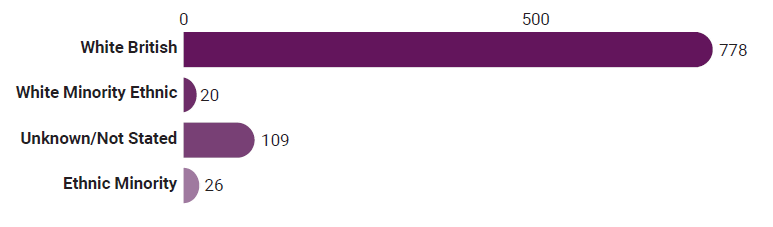
| White British | White Minority Ethnics | Unknown/Not Stated | Ethnic Minority | Grand Total | |
|---|---|---|---|---|---|
| Number | 778 | 20 | 109 | 26 | 933 |
| Percentage | 83.39% | 2.14% | 11.68% | 2.79% | 100% |
Avon Fire & Rescue Service Ethnicity Figures
Methodology
AF&RS employees fall broadly into two main groups: uniformed and non-uniformed staff.
Uniformed staff include (pay and conditions negotiated nationally):
- Wholetime firefighters – full-time operational roles
- On-call firefighters – part-time roles who respond via pager
- Control staff – who co-ordinate operational activity from our control room
Non-uniformed staff (locally negotiated salaries that are set using the Hay Job Evaluation System):
- Deliver a wide range of specialist professional services. They are non-operational, typically work a 37-hour week, and have locally negotiated conditions of service.
The data used for this analysis is based on the statutory gender pay gap snapshot date of 31st March 2025, which is also used for the ethnicity pay gap analysis to ensure consistency across the report. Employee demographic information relating to gender and ethnicity is extracted from Firewatch by the Corporate Performance Unit.
This data is then combined with the Employee Pay Report generated by Payroll through the iTrent system. The datasets are matched to enable the production of salary information disaggregated by gender and ethnicity, including the calculation of full-time equivalent (FTE) hourly rates.
Gender is self-declared using the categories within Firewatch. For the purpose of this report, and in line with government guidance, only employees who have identified as male or female have been included in the report data.
This report follows the UK government’s established standards for ethnicity data reporting, which are part of the Inclusive Britain action plan. These standards aim to ensure responsible and accurate reporting on race and ethnicity, contributing to the government’s commitment to racial equality. For the purpose of this report, and in line with government guidance, only employees who have identified their ethnicity have been included in the report data.
The report excludes Fire Authority members and individuals on zero-hours contracts. Employees with secondary on-call contracts are treated as separate employment records, reflecting their distinct roles and pay structures. Only earnings relevant to hourly rate calculations are included. Overtime, non-contractual payments, and non-salary benefits are excluded to align with national gender pay gap reporting requirements.
After the combined dataset is created, pay records are sorted in descending order and the following metrics are applied:
- Mean (average) hourly rate: Is calculated by dividing total pay by the number of employees in each group. This reflects the overall distribution of pay across the workforce.
- Median hourly rate: Is the midpoint value when all pay data is arranged from lowest to highest. This reduces the impact of unusually high or low values.
Gender Pay Gap Data
| Female | Male | Percentage (%) | Gap | |
|---|---|---|---|---|
| Mean hourly rate | £19.04 | £18.65 | +2.07% | +£0.39 |
| Median hourly rate | £17.20 | £17.20 | 0.00% | £0.00 |
Salary Quartile Bands – All Staff
| Hourly Rate Range | Female | Total | % Female | Male | % Male | |
|---|---|---|---|---|---|---|
| Quartile 4 (Highest paid): | £19.07 – £75.01 | 68 | 232 | 29.3% | 164 | 70.7% |
| Quartile 3 (Mid-Upper): | £19.07 – £17.20 | 31 | 233 | 13.3% | 202 | 86.7% |
| Quartile 2 (Mid-Lower): | £17.20 – £17.20 | 22 | 232 | 9.5% | 210 | 90.5% |
| Quartile 1 (Lowest paid): | £17.20 – £12.60 | 86 | 232 | 37.1% | 146 | 62.9% |
| Total | 207 | 929 | 722 |
Salary Quartile Bands – Percentage Breakdown Per Gender
| Female | Total | Female % | Male | Male % | |
|---|---|---|---|---|---|
| Quartile 4 | 68 | 232 | 32.9% | 164 | 22.7% |
| Quartile 3 | 31 | 233 | 15% | 202 | 28% |
| Quartile 2 | 22 | 232 | 10.6% | 210 | 29.1% |
| Quartile 1 | 86 | 232 | 41.5% | 146 | 20.2% |
| Total | 207 | 929 | 722 |
Gender Pay Gap Data Analysis
The distribution of male and female employees across the salary quartiles continues to show patterns that influence our gender pay gap. Women make up 22.28% of the overall workforce, but their representation varies significantly across pay levels. Women are most represented in the lowest-paid quartile, where they account for 37.1% of employees. This reflects the higher proportion of women working in lower-graded non-uniformed roles. Female representation is lowest in the middle quartiles (9.5% and 13.3%), which are predominantly occupied by operational roles where the workforce remains largely male. In the highest-paid quartile, women represent 29.3% of employees. While this is higher than in the middle quartiles, men continue to make up the majority of senior and higher-paid operational roles.
Looking at the distribution another way – by assessing the proportion of each gender found in each quartile -shows a similar picture. For women, 32.9% are in the highest-paid quartile, compared with 22.7% of men. However, 41.5% of women are in the lowest-paid quartile, compared with only 20.2% of men. Men are far more likely to be found in the middle quartiles, with 28.0% in Quartile 3 and 29.1% in Quartile 2, compared with just 15.0% and 10.6% of women respectively. Overall, this pattern demonstrates that the gender pay gap is primarily driven by workforce composition. Women are more likely to occupy lower-paid non-uniformed roles, while men remain disproportionately represented in operational and mid-range roles, as well as making up the majority of higher-paid positions.
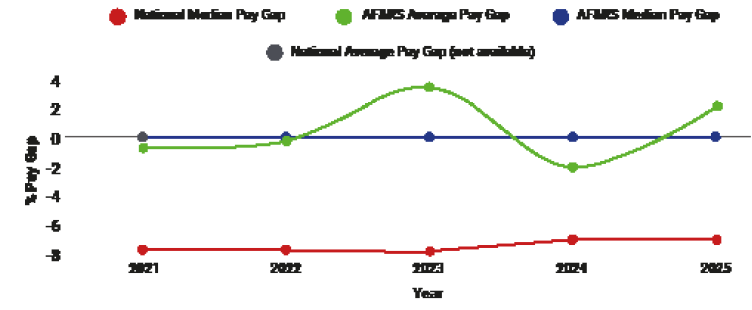
Avon Fire & Rescue Service Progress and National Comparison
Ethnicity Pay Gap Data
Salary Quartile Bands – All Staff
| White British | Average all minority groups | Not known or stated | White | Ethnic Minority | Grand Total | |
|---|---|---|---|---|---|---|
| Count | 778 | 109 | 20 | 26 | 933 | |
| % of workforce | 83.4% | 11.7% | 2.1% | 2.7% | 100% | |
| Average hourly rate (£) | £18.87 | £18.42 | £18.02 | £17.98 | £18.50 | £18.74 |
| Mean pay gap (£) | -£0.45 | -£0.85 | -£0.89 | -£0.37 | -£0.13 | |
| Mean pay gap (%) | -2.4% | -4.5% | -4.7% | -2.0% | -0.7% | |
| Median hourly rate | £17.20 | £17.20 | £17.20 | £17.20 | £17.20 | £17.20 |
| Median pay gap (£) | £0.00 | £0.00 | £0.00 | £0.00 | £0.00 | £0.00 |
| Median pay gap (%) | 0.0% | 0.0% | 0.0% | 0.0% | 0.0% |
Mean Pay Gap
The average mean pay gap for all minority groups combined is £0.45 This equates to a mean pay gap of 2.4%
Median Pay Gap
The average median pay gap for all minority groups combined is £0.00 This equates to a median pay gap of 0.00%
Ethnicity Pay Gap Data Analysis
The distribution of employees by ethnicity continues to influence our ethnicity pay gap. White British employees make up 83.4% of the workforce, while ethnic minority groups represent 2.8%, and White Minority Ethnic employees account for 2.1%. A further 11.7% of staff have not stated their ethnicity, which limits the accuracy of the analysis.
The median hourly rate is the same for all groups (£17.20), resulting in a 0% median pay gap. This shows that pay is equal at the midpoint. However, the mean hourly rate tells a different story: White British employees earn £18.87, compared to £18.42 for minority groups on average – a gap of -2.4%. The largest gap is for White Minority Ethnic employees, who earn 4.7% less than White British employees. Ethnic Minority employees are closer to parity at -2.0%.
This suggests that while pay equality exists at the median, minority groups are less represented in higher-paid roles, which drives the mean gap. Small sample sizes and a high proportion of unknown ethnicity declarations make these figures sensitive to individual variations.
Overall, the ethnicity pay gap is modest, but it reflects workforce composition rather than direct pay inequality. Improving ethnicity declaration rates and supporting progression for minority employees will help address this imbalance.
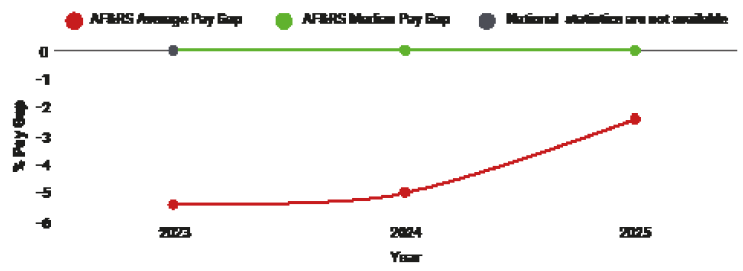
Avon Fire & Rescue Service Progress
Conclusion
For gender, women are most represented in the lowest-paid quartile (37.1%) and least represented in the middle quartiles (9.5% and 13.3%), which are dominated by operational roles. In the highest-paid quartile, women represent 29.3%, but men still hold most senior positions. This pattern explains the gender pay gap, as women are more likely to occupy lower-paid roles.
For ethnicity, the median hourly rate is equal across all groups (£17.20), resulting in a 0% median pay gap. However, the mean hourly rate shows a gap: White British employees earn £18.87, compared to £18.42 for minority groups- a difference of -2.4%. The largest gap is for White Minority Ethnic employees (-4.7%), while Ethnic Minority employees are closer to parity (-2.0%). This suggests minority groups are under-represented in higher-paid roles, which drives the mean gap. Small sample sizes and incomplete ethnicity declarations make the data sensitive to variation.
Both pay gaps reflect structural composition rather than unequal pay for equal work. To address these:
- Increase representation of women and minority groups in higher-paid and operational roles.
- Improve data completeness, particularly ethnicity declarations, to strengthen analysis.
- Support career progression for under-represented groups through targeted development and recruitment strategies.
Overall, while median pay gaps show equality, mean gaps highlight the need for action on workforce diversity and progression to achieve long-term pay parity. While changes in workforce composition may take time, it is essential to take proactive steps to increase representation, particularly in operational roles (quartiles 2 and 3). To influence positive change in the coming years, the service must commit to fostering inclusive practices and ensuring equitable promotion opportunities now.
Supporting Information
- ACAS Ethnicity Pay Gap Reporting
- ACAS Gender Pay Gap Reporting
- Avon Fire and Rescue Service Gender Pay Gap Report 2021
- Avon Fire and Rescue Service Gender Pay Gap Report 2022
- Avon Fire and Rescue Service Gender Pay Gap Report 2023
- Avon Fire and Rescue Service Gender Pay Gap Report 2024
- Government Guidance for Gender Pay Gap Reporting
- Government Guidance for Ethnicity Pay Gap Reporting
- Inclusive Britain: government response to the Commission on Race and Ethnic Disparities
- Office for National Statistics Gender Pay Gap Statistics