Introduction
Welcome to our Annual Performance Report. This report is designed to provide a high-level overview of the performance relating to Avon Fire and Rescue Service (AF&RS) priorities for 2024/25.
I am pleased to report that we have met almost all of our performance targets. we have continued to meet our response standards, have driven down risk by meeting, or coming close to meeting, our incident reduction targets and have very high levels of customer satisfaction both with the speed of our response and the overall satisfaction with our service.
We have also continued to make progress in reducing our carbon emissions, working towards our target of Net Zero carbon by 2030 and have met our statutory responsibility to process Freedom of Information requests. Our Business Fire Safety teams continue to work hard, meeting our targets for processing Building Regulation and Licencing applications and completing fire safety Audits.
In 2024/25 we started a new process where our fire crews would undertake Fire Safety Checks at business premises, and I am pleased to report we completed 1287 of these checks, helping to reduce risk in our community.
We publish a Service Plan that sets the strategic direction for the Service, setting out what we will do to ensure we deliver a high-quality, best value fire and rescue service through our strategic priorities of Making Our Communities Safer and Making Our Service Stronger. The Service Plan is available on our website.
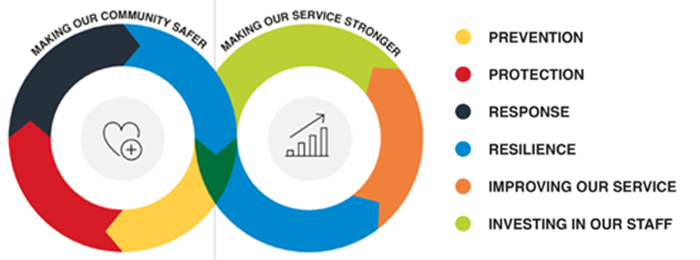
Our performance metrics in 2024/25 were grouped under six key objectives as illustrated below:
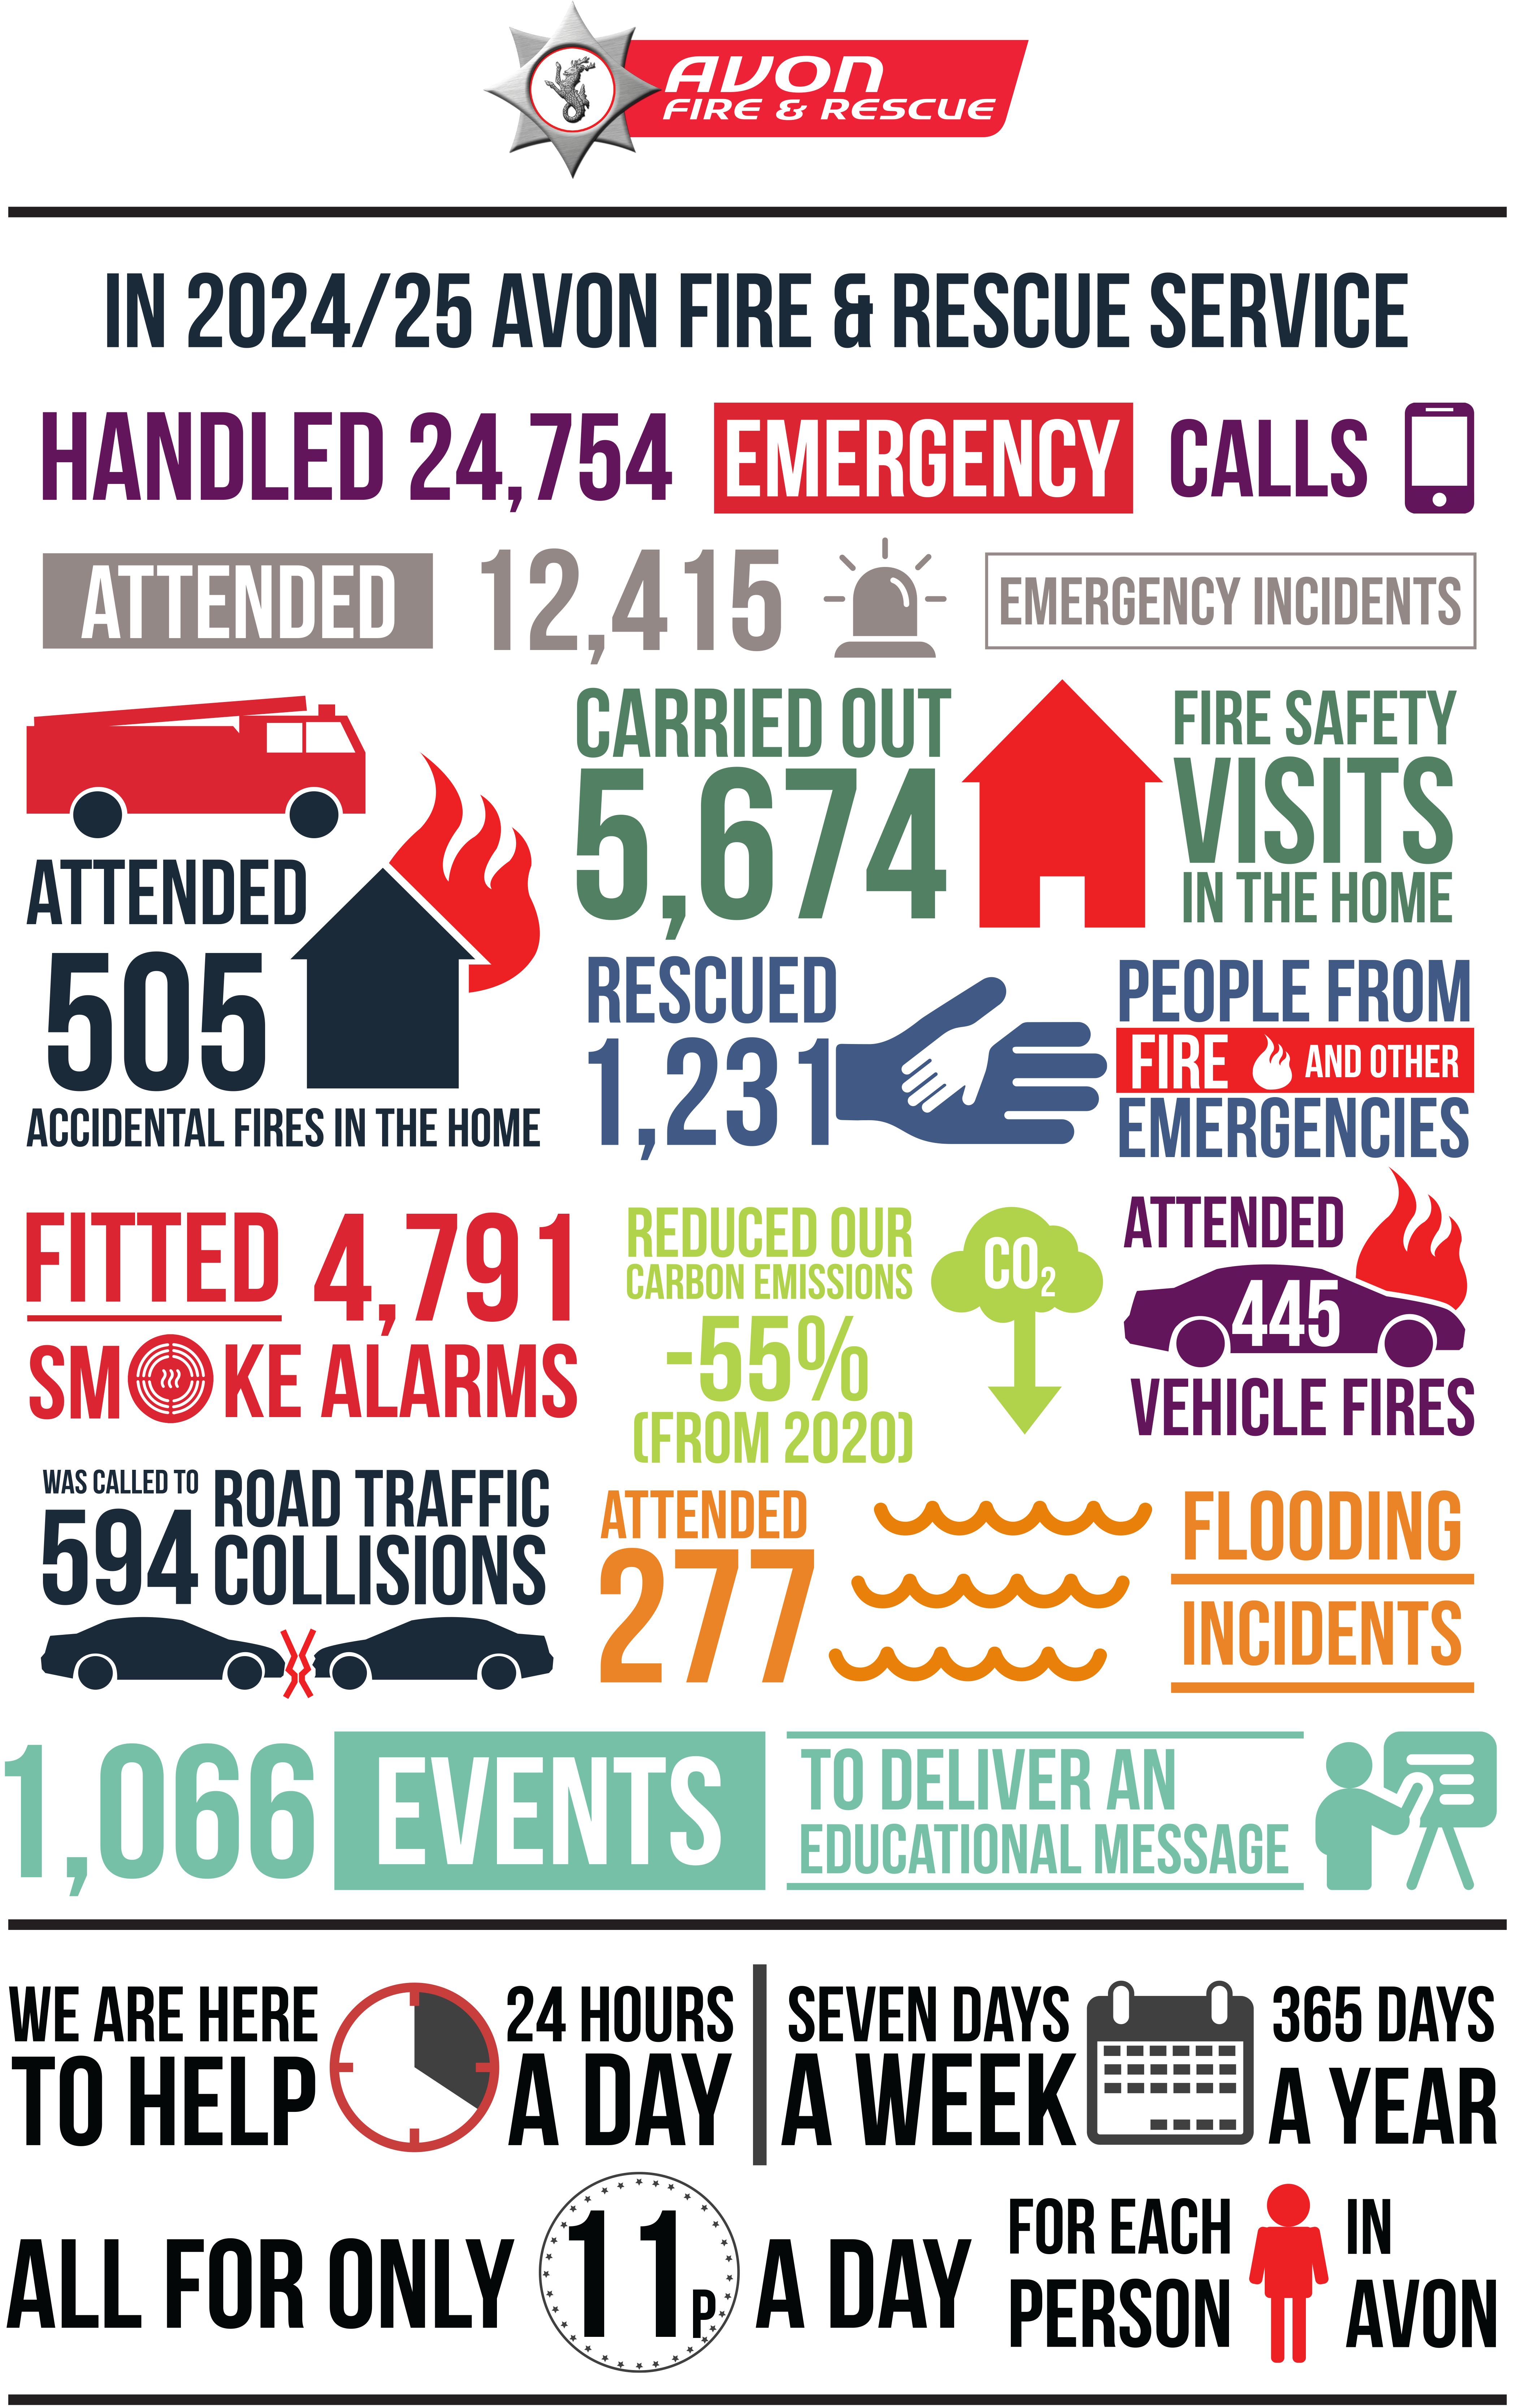
We also produce a poster that is displayed on our fire stations and other media and gives a summary of the great work we have achieved. I hope that you will find our performance report useful in keeping you informed about the service we provide.
As Chief Fire Officer, my priorities are centered around service:
- Serving You, Empowering Us: I’m committed to ensuring you have the leadership and a supportive culture that allows you to thrive as one team. This means ensuring we can carry out our crucial work together safely and effectively, within an inclusive and positive environment that prioritises wellbeing.
- Serving Our Communities, Building Trust: We are here for every member of our community, and to help each other in that single endeavour. I’m dedicated to strengthening our relationships, fostering trust, and working collaboratively to make our four unitary authorities an even safer place for all.
- Embracing Continuous Improvement: Together, we will build on the strong foundations of Avon Fire & Rescue Service by embracing new ideas and always striving to improve in everything we do.
I am excited about what the future holds for Avon Fire and Rescue Service and I’m really looking forward to continuing to make a positive impact on people’s lives and creating an even stronger and more resilient service for the communities we serve.
Matt Cook
Chief Fire Officer/Chief Executive
Overall activity
Attended Incidents
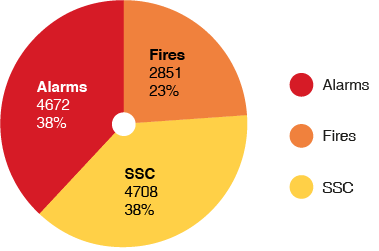
Incidents that we attend are categorised into three main types:
- Fires – where there is an emergency caused by fire ignition
- Special Service Calls (SSC1) – any other emergency response
- Alarms – any incident where upon attendance no additional risk was found.
The chart below shows the % of the total incidents we attended broken down into the three categories:
Fires
We have a statutory duty to attend all fires and are the lead agency for reducing risk in our community by preventing fires. For some fire categories we set reduction targets and our progress is set out in the progress against targets section below.
SSCs
SSCs cover a wide range of activities from non-fire road traffic collisions to assisting the ambulance service with gaining entry to people who need medical attention.
We don’t set reduction targets for SSCs as, unlike with fires, we only attend where there is a need for the fire service to attend. For example, in Road Traffic Collisions (RTCs) we only attend if there is a role we can play in dealing with the emergency and for animal rescues, we will usually offer practical advice and engage with the RSCPA before attending.
| 2023/24 | 2024/25 | Difference | % change | |
|---|---|---|---|---|
| Effecting entry/exit | 910 | 1106 | +196 | +22% |
| Road Traffic Collision | 570 | 541 | -29 | -5% |
| Assist other agency | 693 | 1115 | +422 | +61% |
| No action | 342 | 405 | +63 | +18% |
| Flooding | 288 | 277 | -11 | -4% |
| Lift release | 209 | 198 | -11 | -5% |
| Animal assistance | 174 | 178 | +4 | +2% |
False Alarms

False Alarms fall into three main categories:
- Due to apparatus – where an alarm system has alerted us. We set a target to reduce the number of these false alarms in Business Premises
- Malicious alarms – where there was no risk, and we were alerted with malicious intent
- Good intent alarms – where there was no risk and we were alerted with good intentions.
The 4,672 false alarms we received are broken down into these categories as follows:
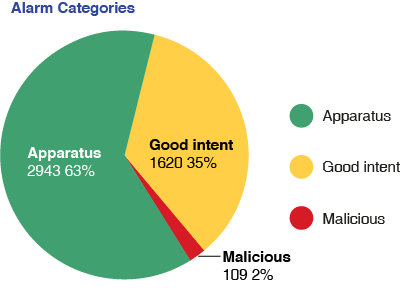
Further information about alarms due to apparatus and malicious alarms is included in the Protection section below.
Measuring interventions and outcomes
AF&RS measure performance using a number of performance metrics. We have designed these indicators to measure how effective we are at meeting our six key objectives. Performing well against these metrics gives a good indication that we are achieving our strategic priorities of Making Our Communities Safer and Making Our Service Stronger.
Customer surveys
We send out customer surveys to a randomly selected group of people who have had an emergency incident in their home or business or who have received a home fire safety visit. The survey forms are returned directly to an independent research company. Over the last few years our surveys found that 97% of respondents were satisfied with the overall service at emergency incidents.
How are we doing?
We continue to make good progress in reducing risk in our community by reducing the number and impact of incidents attended. We have met the targets for most of our fire incident indicators. Each incident that is prevented represents a reduction of risk in our community.
We are committed to doing all that we can to make our community safer and our Service stronger. We continue to analyse our data to understand where, when, why and how incidents occur, evaluate the effectiveness of our interventions and help inform new interventions.
Checking our progress
Our website has monthly and annual data extracts of all the incidents we attend. These are in a format that allows anyone to download and analyse our data.
Prevention
Fires
We measure fires in a number of different ways dependent on the type of property involved and whether the cause of the fire is accidental or deliberate. In broad terms we describe a fire as primary if it affected a non-derelict property and secondary for other fires. An accidental fire is where it is caused by accident or carelessness (not thought to be deliberate) whereas a deliberate fire is where we have suspicion of arson or malicious intent. Our fire officers record the reasoning behind their decision as to cause. All fires thought to be deliberate are reported to the police.
We have four main fire types that we measure our progress against, and we set targets for reducing incidents for these fire types. The fewer incidents, the more successful we have been in reducing risk in our community.
Our targets for fires are based on the average of the last six years, excluding the highest and lowest year.
Accidental dwelling fires
We are just off target with 505 accidental dwelling fires against a target of no more than 486. We record a wide variety of information about each incident including what our investigations tell us were the causes and the behaviours that led to the fire happening.
For example 37% of fires involve people living on their own and 17% involved people being distracted or falling asleep.
We also measure the number of incidents where, though we have attended, no firefighting is required. This means that though there was a fire, the alarm systems and safety education we have helped put in place has minimised the impact of the fire. In 2024/25 this was the case for 45.1% of accidental dwelling fires (228 out of 505) and it is a good measure of our success in protecting our communities against fire.
Deliberate primary fires
Deliberate primary fires cover a wide range of property types, from fires in our prisons to fires in sheds. In 2024/25 we attended 210 deliberate primary fires against a target of 201.
Each deliberate fire is reported to the police and our team of fire investigators will attend major incidents, often with our police Crime Scene Investigator colleagues, to help ensure that where a crime has been committed the offenders are brought to justice.
We also run a fire safety intervention scheme to work with young people who have an interest in fire which is putting themselves, their family, friends and homes at risk.
Deliberate vehicle fires
We attended 246 deliberate vehicle fires against a target of 270. In the last 16 years the number of deliberate vehicle fires has reduced by 60% (246 compared to 618).
Deliberate secondary fires
In 2024/25 we attended 774 deliberate secondary fires against a target of 945. 13% of these fires are caused by people setting light to loose refuse and 12% are fires in small bins.
Safety in the community
We ensure that we proactively target Home Fire Safety Visits (HFSVs) to people in our community that are most vulnerable. This helps to ensure that we are making the best use of our resources. HFSVs are where we visit people in their home to deliver safety advice and, if needed, install smoke alarms. We set a target to complete 7000 HFSVs but fell short of this, completing 5674. However, we completed 88% of HFSVs within time, meeting our 85% target.
Our customer satisfaction surveys found that over the last seven years 93% of respondents were very satisfied with the HFSV check provided.
If you are aware of any vulnerable people who may benefit from a visit please phone us on 0117 926 2061 or access the Home Fire Safety Visits page of our website.
The number of educational events we attended increased to 1066 against a target of 700, delivering a variety of interventions to keep children safe.
Fire Deaths, Injuries and Rescues
Each fire fatality is a tragic event, and we will continue to do what we can to reduce the numbers of people dying due to fire. We do not set a target for deaths and injuries from fire as thankfully the numbers are too low for a target to be meaningful. We do however monitor each incident to learn what we can and to try and ensure such a tragedy does not occur again.
In 2024/25 we recorded three fatalities in fires. Two of the fatalities were thought to be deliberate cause, two were in dwellings and one in other residential accommodation. We also recorded 55 injuries in fires that required hospital treatment and rescued 74 people from fire incidents.
Protection
Alarms
Malicious alarms
Each malicious alarm that we attend increases risk in our community. In 2024/25 we received 113 malicious alarms, down from 157 in the year before.
Malicious alarms can be anything from deliberately breaking a fire call point to phoning 999 about non-existent emergencies. We may take action against such callers and, for frequent callers, will report the abuse to their mobile phone company; in extreme circumstances we will seek to prosecute. We also share information with other emergencies services about people who make malicious alarm calls.
We do what we can to “call challenge” malicious alarms using information we have about where the call is being made in relation to the stated location and questioning the caller if there is doubt about the validity of the call. In 2024/25, through call challenging, we did not attend two malicious alarms.
Fire alarms in non-dwellings
We attended 494 fire alarms in non-dwellings, meeting our target of no more than 515. These are incidents where the fire alarm has activated and upon attendance, we have found that there was no fire or other risk.
40% of these alarms are caused by human error, mainly due to burning food or accidentally setting off the alarm, both of which are preventable.
Response
We do not set targets for the number of calls that we receive or the number that we attend. We continue to attend all reported incidents where there is any concern that there may be a risk to people or property.
We do however monitor both the number of calls and the number attended to help ensure that we are resourced effectively to meet local demand and risk.
Overall, we received 24,754 calls for emergency assistance, responded to 13,156 of these, and attended 12,415.
Where we don’t attend it is either because questioning by our Control team found that there was no emergency to attend, or we received further information that there was no emergency and turned back before we arrived at the incident. We always try to reduce risk by ensuring that we only send appliances where there is an indication that there may be an emergency. If there is any doubt we will always send an appliance.
We measure our response using a risk-based approach, ensuring that we respond quickest to incidents with the most risk. For each of our two response risk categories we set a target based upon the average time from when we alert our appliances to when they arrive on scene.
For emergency critical responses (where there is a known life risk or involving a property) our target is an average of 8:00 minutes and on average in 2024/25 we took 7:28 minutes compared to 07:33 last year.
For emergency non-critical responses our target is an average of 12:00 minutes and on average we took 7:46 minutes, compared to 7:41 last year.
We validate our response standards through our customer satisfactions surveys. Over the last few years 94% of respondents thought we arrived at the scene of the emergency quicker than expected or as they expected.
Where we have not met our response standards it is usually because the nearest fire appliances were committed to dealing with other incidents.
Call handling
With 95.8% (15,774 out of 16,457) of calls answered within seven seconds our Control team met their target of answering at least 94% of 999 calls within seven seconds. The number of calls answered is higher than the number of emergency calls received as not all 999 calls are found to be reporting an emergency.
Resilience
Sickness absence
We measure sickness by dividing the number of days/shifts lost by the number of staff we have. We use the Full Time Equivalent (FTE) figure meaning that if someone works half hours we count them as half an FTE member of staff.
On our key measure of shifts/days lost per FTE member of staff we made good progress from 2004 to 2013 but from 2013 to 2023 we had increases in lost days/shifts. Our target for reducing sickness is based upon the average for Fire & Rescue Services nationally.
In 2024/25 we lost 9.53 days/shifts per FTE, not meeting our target of 8.11. The main cause of this is staff who are long term sick (more than 28 days) which accounted for 61% of the total days/shifts lost.
The most common reason for sickness absence is cold/flu/virus which was the cause for 25% followed by Musculo Skeletal at 19%.
For 2025/26 our target will increase as the national average sickness rate has increased, but the new target is set to still be better than the national average.
We are continuing to embed our supporting attendance policy that will help our management of sickness absence.
Improving our Service
Health and Safety
We acknowledge the importance of protecting our staff by having effective health and safety processes. We have three metrics that measure our effectiveness. We monitor the number of Reporting of Injuries, Diseases and Dangerous Occurrences Regulations and we reported 13 incidences in 2024/25. We recognise that an effective health and safety culture promotes the reporting of near miss incidents, and we have a target to ensure that at least 50% of incidents reported are near misses. We just missed this target with 47% reported. Going forward we will continue to promote the importance of reporting. We also recognise the importance of timely investigations and have a target for 80% of incidents to be investigated and closed within 28 days. We achieved this with 89% meeting target.
Environmental
We are proud of the work that we are doing to use resources more efficiently and to play our part in addressing environmental issues. In 2020 we set an overarching environmental target to reduce net carbon emission to zero by 2030.
We have set a non-linear target recognising that progress will be made, once we can make progress with big ticket items such as decarbonising our fleet. For 2024/25 our target was a 55% reduction from 2020 which we are pleased to report we have achieved, this is largely due to offsetting gas and electricity consumption as the service is now using certified green energy.
The split between fleet and property sits at 43% of carbon coming from Property and 57% coming from fleet.
Our focus in the 2025/2026 financial year will be to tighten the monitoring and maintenance plans for our solar installation to ensure maximum production, to continue to explore Hydrotreated vegetable oil as an alternative fuel for our front line fleet, to support the Bath fire station redevelopment project and ensure the best environmental outcomes are achieved, and to review the recently completed Heat Decarbonisation Plan for the estate to plan interventions appropriately.
Budget
We measure the effectiveness of our financial management by ensuring that the variance of both our Budget variance against forecast and our Revenue Budget variance against planned is maintained, with no more than 1% and no fewer than 2.5% variance. We are pleased to report than both measures met target with -2%. The revenue budget variance of a positive 2% has arisen as a result of an overall underspend against the initial budget set for 2024/25. This underspend has arisen for a number of reasons, including the receipt of a £500k credit in relation to the Airwave Communication System costs the Service incurs, and underspends on Wholetime firefighter costs due to vacant positions throughout the year. This underspend has allowed the Service to top up reserves to help ensure resilience in future years.
Freedom of Information
We recognise the importance of making our data available to stakeholders and work hard to ensure that we process Freedom of Information requests within 20 days with a target of 85%. We are pleased to report that we met this target processing 98.7% in target. We also publish our incident data on our website and where appropriate direct requests to this data.
Procurement
We appreciate the value of effective procurement management, ensuring that our contracts with our suppliers are kept in date. We have a target to have at least 85% of contracts in date and at the end of 2024/25 we achieve this ending the year with 96.2% in date.
Collaboration and Partnerships
We have a process to manage our collaborations and partnerships, recognising the importance of working effectively with other stakeholders and agencies. We also ensure that our partnerships and collaborations are evaluated to ensure they are effective and set a target to have 90% of our collaborations evaluated. We are pleased to report that at the end of 2024/25 we met target with 100% of our collaborations evaluated for their effectiveness.
Policies
We understand the importance of having a focussed set of policies to underpin our service. We also recognise the importance of ensuring that these polices are kept up to date and have a target of 100% of policies in date. At the end of 2024/25 we were just off target achieving 98%.
Information and Communication Technology
We recognise the necessity of having robust Information and Communication Technology (ICT) systems that maintain availability to our staff and stakeholders. We have a metric measuring the availability of our Non-emergency ICT system availability with a target of 98% and are pleased to report that we met this with 100% availability.
Improvement Actions
We have a number of stakeholders who inform and help to shape our Service and their input helps to inform what and where we are seeking to improve. We manage and measure our progress by having a single register of Continuous Improvement actions. We have a metric in place to ensure that the actions are implemented as planned with a target of 85% in date. At the end of 2024/25 we met target with 89% in date.
Invest in our staff
Fitness Tests
Fitness tests in date finished the year on target with 87% of relevant staff having an in date test. This is testament to the excellent coordination work undertaken by the Health and Wellbeing team.
Staff appraisal completion
Personal Development Reviews (PDR) were just off target with 94.6% of staff having an in-date PDR against a target of 95%.
Other performance measures
Compliments and complaints
We monitor the compliments and complaints that are received and use this information to improve the service we provide. In 2024/25 we received 36 complaints, 28 about our service and eight about staff behaviour. For the 28 about our service, five were found to be not about us and 15 where we were not at fault. Of the remaining eight where we were at fault, the subjects were:
- Driving of vehicles 3
- Actions at emergency incidents 1
- Community safety 1
- Water incident training 1
- Management of our premises 1
- Recruitment process 1
The numbers are too small to identify any common patterns or causes. In 2024/25 the Local Government and Social Care Ombudsman confirmed they received no queries regarding our response to complaints.
In 2024/25 we also recorded 83 compliments about our service. We ensure that all compliments are passed on to the teams involved and, where particular praise is given, we publicise this to all of our staff. We would like to thank the community for their support.
We took a group of Cubs aged 8-10.5 years to Patchway Fire Station and the firefighters were excellent – they pitched their presentation to the age group and made it fun and interesting. They were quite impressed with the knowledge the Cubs already had about the dangers of fire. A really excellent evening. Thank you so much